Chapter 4 Measuring Artificial Intelligence with patent data
In chapter three, I presented how episodes of acceleration in economic growth can be driven by particular technologies, often referred to as General Purpose Technologies (GPTs). Artificial Intelligence is configuring as such a technology, while simultaneously being widely used in R&D efforts, thus making it a good candidate for the new technological category of General Method of Invention. However, while there is sufficient qualitative proof on the GPT character of AI technologies, at present there is no research that verifies these claims from an empirical perspective. It is common practice for scholars studying the economics of innovation to rely on the quantitative analysis of patent documents to investigate the diffusion of technology in society. This chapter aims to build on the rich literature on GPTs and Artificial Intelligence to explore whether AI could be considered as such, and to serve as the basis for further empirical research regarding the categorization of AI as a GMI.
4.1 Literature review
In the past few years, the gain in popularity of AI technologies has awaken the interest of patent offices and scholars at a global scale. As a consequence, several studies were made to analyze how AI is impacting the innovation panorama, to understand its possible effects on the economy, generally using patent document and research papers as primary data.
4.1.1 Studies on GPTs
After posing a theoretical foundation on the concept of General Purpose Technology, the economic literature started developing ideas on whether it was possible to develop quantitative indicators to operationalize it and detect possible GPTs at an early stage.
Moser and Nicholas (2004) applied criteria proposed by Henderson, Jaffe, and Trajtenberg (1995) to identify whether electricity could be considered a GPT. They found that between 1920 and 1928 there was an enormous increase in the rate of patenting, and thus applied a range of indicators (originality, longevity, and generality) to test this hypothesis. Originality is a backward-looking citation measure that aims to identify the exact arrival dates for influential innovations, longevity is the speed of obsolescence for inventions in different industries, and generality is a classical Herfindahl-Hirschman index that measures the technological diversity range of citing patents.32 They also proposed to use the number of technological classes assigned to each patent as a measure of patent scope. Their findings contradicted the expectations that electricity should be considered a GPT.
Hall and Trajtenberg (2004) focused their efforts on the development of better suited indicators to detect GPTs using patent data. They used citation-based measures as a proxy for determining the GP-ness of a random sample of patents. According to their model, GPT innovations should have many citation form outside their particular technology areas or from industries outside the one in which the patented invention was made. Simultaneously, since GPTs should also be able to spawn innovation in their original application sector, following a pattern of cumulative innovation, GPT patent should also have many citations within their technology area, thus making citing technologies to be subject to increases in the rate of innovative activity. They also suggested that, since GPTs take a long time to spread in the economy, citation lags (the distance between the cited and citing patents) could be longer than average, but that, in the long run, GPT patents should turn up to be highly cited. They expanded the use of the Generality measure, correlating with the absolute number of citations, and they suggested to examine also citations of the second degree33. It is important to note that, in computing the Generality index, when a patent had no citations, \(G\) is not defined, while if the number of citations is equal to \(1\), they chose to assign \(G = 0\). In their analysis, they decided to test the validity of the Generality index based on five different classification systems, three based on technological classification34, and two related to industry35. This choice was motivated by the fact that “it may be argued that a GPT is not likely to manifest itself as a series of citations by patents in different technology classes, but rather as citations by firms in different industries” (Hall and Trajtenberg 2004). To measure the phenomenon of innovation complementarities, they proposed to search for the patent classes that presented a rapid growth in patenting, and then to compare it with the growth rates of the citing patents.
Jovanovic and Rousseau (2005) adopted a different approach, basing their GPT identification process on historical data on the diffusion of electricity and information and communication technologies (ICTs) in the economy. As indicators of pervasiveness they identified the shares of total horsepower in manufacturing by power source, and the share of IT equipment and software in the aggregate capital stock for ICTs. They identified the technical advancement as a function of the cost for an decline in prices, an increase in quality, or both. This choice was motivated by the fact that capital as a whole should be getting cheaper faster during a GPT-era, especially if it involves the new technology. Finally, they used the rate of patenting and investments to identify the technology’s ability to spawn innovation, finding a worldwide increase after the introduction of both technologies. The latter is motivated by the fact that a GPT should increase the rate of investment because it requires the refurbishing of both capital and the skills of labor.
Feldman and Yoon (2012) drew from previous literature to verify whether a specific technology, the Cohen-Boyer’s rDNA splicing techniques, could be considered a GPT. They built three indicators aiming to verify three characteristics of a GPT: technological complementarity, technological applicability, and technological discontinuity. Technological complementarity was computed by counting the number of industrial sectors (identified using Silverman (2002) correspondence table) of first-degree forward citations, technological applicability was instead computed using the proportion of the total forward citations present in patent classes outside the original patent class, while technological continuity is tied to verify the hypothesis that complementary innovation spawns in geographical areas in proximity to those of the original patents. Feldman and Yoon (2012) computed these indicators and then compared them to a control sample.
The most recent work on determining alternative indicators to identify GPTs in patent data is the one of Petralia (2020). This paper is particularly interesting because it is based on different conceptualization of GPTs. Rather that considering a technology either as a GPT or a non-GPT, he speaks of a degree of GP-ness that every technology potentially has. This suits well with the network based view of the technological space mentioned in chapter three, where the extent to which a technology can be considered a GPT is measured on the basis of how much it is capable to potentially connect to other technologies. Although he used the rate of patenting rates in specific fields to identify the first characteristic of GPTs, he adopted a different strategy to identify its pervasiveness and the complementarity between new or existing technologies. In particular, he focused on the degree to which Electric and Electronic (E&E) and Computing and Communication (C&C) technologies are GPTs. Starting from a list of selected keywords for each category (E&E and C&C), he identified technological classes that included the use of these technologies by counting the co-occurence of technological classes based on either the originating patents (Use Complementarity, or UC), or citing patents (Innovation Complementarity, or IC).
4.1.2 Studies on Artificial Intelligence
The ways AI technologies are spreading in the economy were the subject of several empirical studies, that aimed to map the AI industry or understand whether they could be considered a GPT, or a GMI. Since AI technologies are particularly difficult to define, much attention has been devoted to correctly identify AI-related scientific publications and patent documents.
The first study specific of AI technologies was conducted by Cockburn, Henderson, and Stern (2018), and aimed to map the different fields of AI to evaluate how it could be characterized. Their analysis “draws on two different datasets, one that captures a set of AI publications from Thompson Reuters Web of Science, and another that identifies a set of AI patents issued by the U.S. Patent and Trademark Office”, (Cockburn, Henderson, and Stern 2018). To identify patents related to AI technologies, they assembled a dataset of patents associated with AI-specific codes of the U.S. Patent Classification System and a second dataset of patents by conducting a title search on patents, using a list of keywords. By assembling these two subsets and dropping duplicates, they created a sample of \(13615\) patents from 1990 to 2014. Subsequently, they subdivided the sample in three major categories of AI technologies: learning system patents, symbolic system patents, and robotics patents, with the objective of mapping the distribution of different kinds of AI technologies. They only focused on the pervasive character of GPT, and they encountered empirical evidence that learning-oriented AI systems seems to have some of the characteristics of being a GPT, since they are applied in a variety of sectors, especially in the “most technologically dynamics parts of the economy” (Cockburn, Henderson, and Stern 2018).
Klinger, Mateos-Garcia, and Stathoulopoulos (2018), used a combination of open-source paper databases (arXiv, Microsoft Academic Graph, and Global Research Identifier) and CrunchBase, to measure the geography and impact of Deep Learning (DL), the most promising field of AI. They argue that AI could change world economic geography, affirming that governments now have launched in an AI race. To identify AI-related papers, they used Natural Language Processing techniques, and then matched the scientific areas with CrunchBase industry sectors. To verify whether DL could be considered a GPT they measured the growth in publication of Deep Learning-related papers, finding that the share of DL papers in the total has increased from 3% before 2012, to 15% afterwards. Then they measured the number of DL-related papers in different arXiv subjects, finding that there is a visible upward trend in the relative importance of DL in many computer science subjects. Finally, they evaluated the impact of DL in other fields using citations as a proxy of knowledge diffusion, finding that in most arXiv subjects, DL-related papers occupied a larger share than average in highly cited papers.
In a similar fashion, Bianchini, Müller, and Pelletier (2020) conducted an analysis of citation patterns of scientific publications (based on the combinations of arXiv and Web of Science data). They noticed that in recent years there has been an increase in the research activity involving Deep Learning technologies in all areas of science taken into examinations. They confirmed Klinger, Mateos-Garcia, and Stathoulopoulos (2018) findings and affirmed that Deep Learning publication activity also grew “relative to the overall number of papers in scientific areas”. Moreover, they observed that different research fields reacted in different ways to the introduction of Deep Learning, as a signal that there may have been field-specific bottlenecks that were solved in various points in time. Additionally, they propose that the fact that the proportion of DL articles containing “computer science” as one of their labels is progressively diminishing suggests that “the diffusion of DL into application domains began with an interdisciplinary effort involving the computer sciences, breaking its way into ‘pure’ field-specific research within the various application domains”. This observation adds to the precedent evidence in confirming that the mechanism of innovation complementarities is taking place in, at least, academia.
Two additional empirical studies on AI technologies are worth mentioning, not because they are targeted to determine whether AI should be considered a GPT, but rather because they were commissioned to assess the state of AI technologies in the economy. They are based on patent analysis and were commissioned by important players in the innovation scenario: WIPO, and USPTO.36
The WIPO study on AI was commissioned in the context of the 2019 WIPO technology review (Benzell et al. 2019) to assess the state of AI research and technology. WIPO analyzed patent data to identify the patent families related to AI technologies based on the Questel Orbit patent database. Of particular interest is the query strategy used to identify AI-related patents, since the one I adopted in the empirical study for this dissertation is largely based on it37. To overcome the limits of keywords-based queries, WIPO focused on used a combination of technology classification codes and keywords that led to the gathering of \(339 828\) patents related to AI. Then, using a hierarchical clustering scheme, WIPO was able to divide the technology macroarea in different clusters based on an adaptation of the ACM classification scheme (Association for Computing Machinery 2012), first by subdividing the different technological areas of patents in three categories (AI techniques, functional applications and application sector) and then by clustering the technologies based on different subcategories, allowing them to map the evolution of the AI industry. Among their findings, WIPO reported that AI-related inventions are increasing at an impressive rate, since over half of the identified AI inventions were published after 2013. They identified the area of Machine Learning as the fastest-growing technique, boosted by implementation of Deep Learning and neural networks, and that, starting from 2002, there has been an acceleration in the number of patents regarding AI technology.
Finally, the study commissioned by the USPTO and produced by Toole et al. (2020), aimed to map the AI technological scenario of US patents. This study is of particular interest because it used a supervised machine learning algorithm to identify patents involving AI technologies. The performance for individuating AI patents was later evaluated against the techniques of both Benzell et al. (2019) and Cockburn, Henderson, and Stern (2018) and compared with a human-based examination by AI experts. It resulted that this AI-based classification system outperformed traditional retrieval strategies, reaching an accuracy comparable to that of human examiners. Among its key findings, the study reports that AI has become increasingly important for invention and it spread across technologies, inventor-applicants, organizations, and geography. The share of annual AI patent applications from 2002 to 2018 has increased by more than 100%. Additionally, the USPTO report shows that AI technologies are increasingly expanding towards new areas of invention, since the percentage of technology subclasses present in at least two granted AI patents increased from 10% in 1976 to 43% in 2018.
These studies seem to confirm that Artificial Intelligence technologies are rapidly developing and spreading in the economy, thus favoring the interpretation that AI should be considered a GPT. Moreover, the increase in research output and the widespread diffusion of DL in academia provides an empirical basis to the claims that suggest that AI has the potential to revolutionize the innovative process, by building a new “innovation playbook” that involves the use of large datasets and learning algorithms to both increase the efficiency of individual researchers and discover patterns in complex sets of multivariate data. As Brynjolfsson, Rock, and Syverson (2017) suggested, Artificial Intelligence “has the potential to be pervasive, to be improved upon over time, and to spawn complementary innovation, making it a candidate for an important GPT”.
4.2 Research goals and data
Building on the literature presented above, the analysis that follows aims to:
find additional evidence in patent data of the fact that AI technologies should be considered a General Purpose Technology;
explore the industry structure of the AI field in terms of patenting activity.
The chosen data source are patent documents drawn upon a subset of PATSTAT 2018 Autumn, that provides access to worldwide patent statistical information. Since 2018 data is incomplete, the search was restricted to applications filed from 01/01/1995 to 31/12/2017 under the Patent Cooperation Treaty (PCT), which provides the possibility to seek patent protection for an invention simultaneously in a large number of countries by filing one international application instead of filing several separate national applications. This choice was motivated by the assumptions that:
patents that are filed using the international patent application scheme are the ones most likely to being applied in a variety of different countries. The PCT application procedure is more expensive than national applications so, for an applicant to opt for the international route, the revenues generated by the protected invention needs to be sufficiently high to justify the expenses;
it is only with the harmonization of the international patent legislation through TRIPs that the PCT route started to be consistently used by companies and PCT patents became representative of global patenting patterns. As a consequence, the sample size was restricted to the year following the signing of TRIPs agreements (1995).
The query resulted in the retrieval of \(91796\) unique applications related to AI technologies from 1995 to 2017 over a total of \(3198252\) patents filed using the PCT route. The methodology used for the selection of the patents involving AI technologies is based on the WIPO study (Benzell et al. 2019) and it is described in detail in Appendix B.38
4.2.0.0.1 Some comments on the quantitative analysis of patents
Patents are an invaluable source of data for innovation studies, but since they were not designed for the econometric analysis of technology, rather to act as property assets, the information they provide must be treated with caution. First of all, patents do not cover all aspects of a technology. When an innovation does not fulfill patenting requirements, it cannot be detected by solely using patents. This is often the case for AI technologies, which greatly rely on algorithms and mathematical methods, which private-led innovators may decide to protect through means of trade secrets. If there is a public record of these innovations, it is likely to be present in academic papers, and therefore an analysis exclusively focused on patents would not include this information. Nevertheless, the functional application of AI technologies can be patented, informing on how AI technologies are spreading to a higher degree of abstraction.
Another factor to take into account is that the process of obtaining a patent is designed to be particularly long and expensive, thus increasing the barrier of entry for protection. As a consequence, only the technologies and techniques that are more likely to be a source of consistent profits are going to be patented.
Moreover, the heterogeneous and ever-changing nature of AI technologies may complicate the process of patent identification. In chapter one are provided some qualitative definitions of what can be considered as Artificial Intelligence and a short history of how the concept evolved over time. For the purposes of this analysis I decided to use the widest definition of AI possible, thus including technologies that a part of the literature does not considered AI anymore, such as expert systems.
Information regarding specific technologies in patent data can be found by analyzing technological classification codes. Classification codes are used by patent examiners to classify patent applications and other documents according to their technical features, to facilitate search and examination. Technology classes are generally classified hierarchically, giving the possibility to cut the tree at different levels of abstraction. For the purpose of this analysis I used the 4-digit classification level. Several patent classification systems are used by the various patent offices. In the analysis I mainly used the Cooperative Patent Classification (CPC), jointly developed by the United States Patent and Trademark Office (USPTO) and the European Patent Office (EPO), while in some cases I also used the International Patent Classification (IPC), maintained by WIPO, both of which contains more than 100000 codes.
To identify the evolution of technology, it is common practice to use patent citations. Patent citations have an important legal function, because, as presented in chapter two, they delimit the scope of the property rights awarded by the patent. From this it is generally inferred that, if patent B cites patent A, patent B builds on the knowledge of patent A, over which patent B cannot have a claim. Patent citations are in this case representative of the links between patented innovations. To conduce a quantitative analysis on patents, citation data is relevant because, as Hall and Trajtenberg (2004) affirms, “citations made may constitute a ‘paper trail’ for spillovers”, in other words, we assume a knowledge transfer from the cited to the citing patent. In this framework, citations offer insights regarding the evolution of a particular line of technology and whether a particular invention is used in a wider variety of applications. However, the analysis of citations, especially when dealing with recent data, is limited by truncation: the more recent the patent examined, the less forward citations it will have, as the pool of potential citing patents progressively diminish.
4.3 Artificial Intelligence as a General Purpose Technology
Recalling the definition presented in chapter three, a technology should be considered as a GPT if it follows these three requirements:
technological dynamism;
pervasiveness;
strong complementarity with existing or new technologies.
These three characteristics are complex and intertwined with each other. In particular, measuring both pervasiveness and technological complementarity require the use of multiple indicators, that will be developed in detail in the following sections.
4.3.1 Technological dynamism
Perhaps the easiest characteristic to examine is technological dynamism, since it is, at its core, a growth-based measure. As Hall and Trajtenberg (2004) and Petralia (2020) suggested, I analyzed the percentage of PCT patent applications from 1995 to 2017.
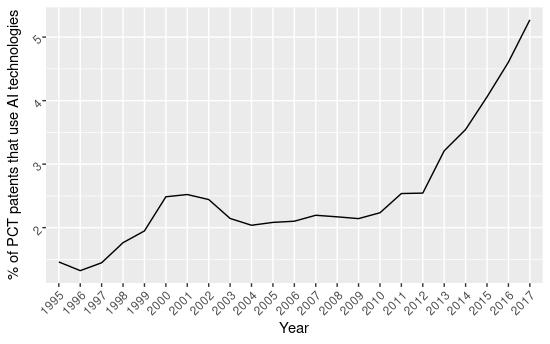
% of AI patents filed over the total number of PCT patents
Figure 1.1 shows the percentage of AI-related patents over the overall PCT patents, suggesting that, starting from 2013, we assist to a progressive increase in the percentage of AI-related patents filed following the PCT route every year. From more or less stable plateau comprised between 1.5 % and 2.5 % from 1995 and 2012, the percentage increases to 3.24% in 2013, up to reach more than 5% in 201739. The timing of this surge in AI patenting is particularly significant. If we recall the historical evidence mentioned in chapter one, 2012 was the year when the new generation of AI technologies (those related to Machine Learning and Deep Learning) took off commercially. Companies realized that AI as a prediction tool could be applied in a variety of different fields and increased their investment in R&D, subsequently filing an increased number of patents, possibly to prevent competitors to claim exclusive rights over specific applications. AI technologies are indeed experiencing a rapid increase in patenting activity, that become more marked from 2012 onwards, up to become the 5.3% of the overall PCT patents in 2017.
4.3.2 Technological pervasiveness and innovation complementarities
Determining the other two features of GPTs (pervasiveness and technological complementarity) using patent data is more complex. First of all, distinguishing the two phenomena is not trivial. Since patented technologies are not composed by general upstream principles, but rather intermediate goods or final products, likely what can be measured is the degree of innovation complementarities caused by GPTs. Nonetheless, basic indicators of pervasiveness may be created by analyzing the percentage of technological fields in which a related technology can be found. Toole et al. (2020) used this strategy to find evidence of how much AI is diffused in the economy. They considered the percentage of technological classes assigned to at least two patents over the total number of available technological classes, broken down by years. In figure 1.2 the evolution of this indicator is shown using both the IPC and CPC technological classification systems at the 4-digit level.
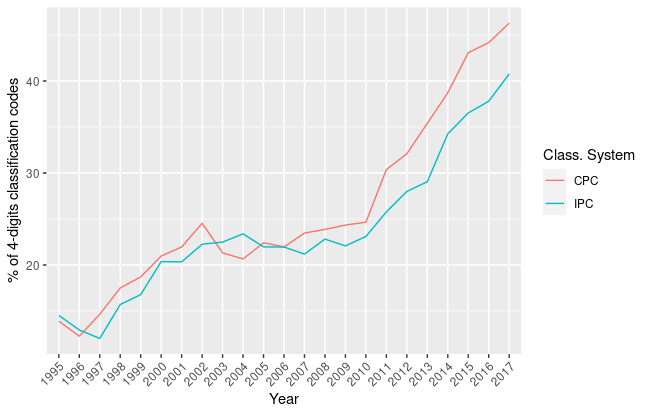
Percentage of 4-digits CPC and IPC classification codes present in AI-related patents
As it can be seen in tables 4.3 and 4.4, the number of technological classes of AI-related patents increased consistently in both classification systems and so their proportion, up to reach almost half (0.45) of all of the CPC symbols and well above one third of all of the IPC symbols in 2017. Again, it is interesting to note that, after a plateau in the 2000s, we assist a consistent and stable increase in the number of technological classification codes used from the early 2010s up until the most recent data available. This constant increase suggests that AI-related technologies are spreading across the economy, involving a variety of final products.
The second patent-based indicator commonly used to identify GPT is the generality index, that aims to determine the degree of innovation complementarities of the technology. Hall and Trajtenberg (2004) suggest that patents that involve GPTs should have many citations from outside their specific technology area while having many citations within their technology, caused by patterns of cumulative innovation. However, given that GPTs take more time to pervade the economy, citation lags for patents in this area may be longer than average, and thus the burst of innovative activity caused by complementary innovation in application sectors may take longer. In a seminal article published in (1993), Jaffe, Trajtenberg, and Henderson (1993) introduced the generality index, an indicator based on the Herfindahl concentration index, that investigates the range of technology fields (and industries) that cite the original patent.
Given a patent \(i\), the generality index is defined as:
\[G_i = 1-\sum_{k=1}^{N_i}{s_{ij}}^2\]
where \(s_{ij}\) is the percentage of citations received by patent \(i\) that belong to the technology class \(j\), out of \(J\) technology classes. \(s_{ij}\) is computed as
\[s_{ij} = \frac{NClass_{ij}}{NClass_J}\]
where \(NClass_{ij}\) is the number of citations the patent \(i\) received from a patent having technology class \(j\), and \(NClass_J\) represents the total number of technological classes associated with the citing patents. So:
\[G_i = 1-\sum_{k=1}^{N_i}{\left(\frac{NClass_{ij}}{NClass_J}\right)}^2\]
Notice that \(0 \leq G_i \leq 1\). Higher values represent a high variability in the technology classes of the citing patents and hence an increased generality.
Since the generality index is a form of the Herfindahl concentration index, it presents the same disadvantages. As Hall (2005) affirmed, this kind of indexes is in general biased downwards with a larger effect for small \(NClass\). Thus, Hall (2005) suggests to correct the bias by computing an unbiased estimator:
\[\tilde{G}_{i} = \frac{NClass_{J}}{NClass_{J} - 1}G_{i}\]
Note that the bias correction is valid only for small N and, adopting Hall and Trajtenberg (2004) methodology, it is computed only for \(NClass_J \geq 2\), to avoid infinite and null values. As a consequence, the formula for computing Generality of a patent \(i\) can be described as:
\[\begin{aligned} \ \tilde{G}_{i} = \frac{NClass_{J}}{NClass_{J} - 1}\left(1-\sum_{k=1}^{N_i}{\left(\frac{NClass_{ij}}{NClass_J}\right)}^2\right) && \text{if} && NClass_J \geq 2 \\ G_i = 1-\sum_{k=1}^{N_i}{\left(\frac{NClass_{ij}}{NClass_J}\right)}^2 && \text{if} && NClass_J < 2\end{aligned}\]
Moreover, as suggested by Hall and Trajtenberg (2004), the generality was not defined for patents with no citations and that for patents receiving only one forward citation, \(G_i = 0\).
For the purpose of this thesis, the generality index was applied to the subset of AI-related patents, using the Cooperative Patent Classification system, the Hall-Jaffe-Trajtenberg 36 technology subcategories and the NACE industry classification v. 2. This choice was motivated by the fact that, recalling the definition of GPT, it is fundamental to analyze the generality of technologies developed by firms in different industries. Thus Hall and Trajtenberg (2004) suggest computing the generality index based on the industry, by associating an technological classes with industrial sectors using a an industry-patent class concordance.40
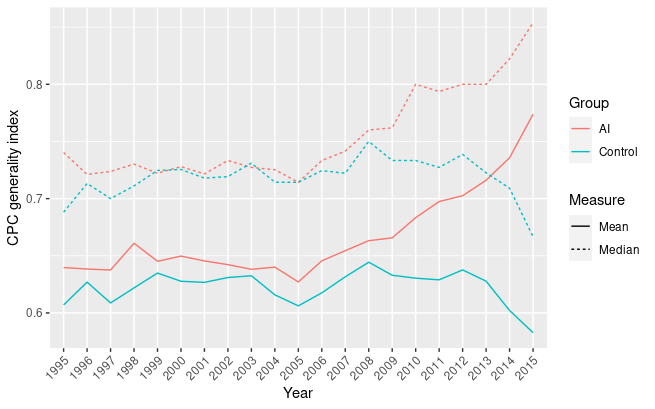
CPC generality index over time
In figure 1.3 the generality index is computed using the CPC technology classes over time of both the AI-related patents and a control sample of patents filed the same year and with the same number of forward citations41. It can be observed that, during the period took into consideration, AI-related patents have a higher generality. However, starting from 2008, they start to diverge, with the generality of AI-related patents increasing up to reach a maximum mean value of 0.77 and the control sample decreasing. This may be caused by the fact that AI-related patents filed after 2008 are being cited by other patents containing CPC symbols of a higher variety of different technological fields, while the technological variety of the forward citations of the control sample becomes lower and lower, indicating a restricted scope of application. This is consistent with both the historical evidence that regards the renewed commercial discovery of AI technologies and previous findings related to the expansion of the fraction of IPC and CPC classification symbols (figure 1.2).
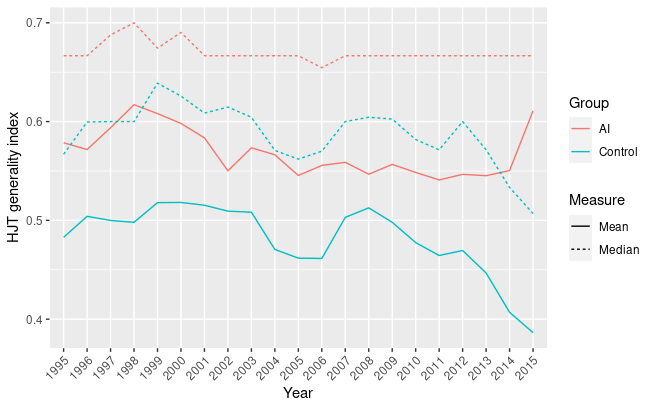
Hall-Jaffe-Trajtenberg generality index over time
To a lower extent, the same trend can be seen in figure 1.4, that shows the generality index computed using the Hall-Jaffe-Trajtenberg technology subcategories. Considering that the number of possible categorization is limited to 36, it is particularly significant that AI-related patents rank consistently higher and that there is a divergence in more recent years.
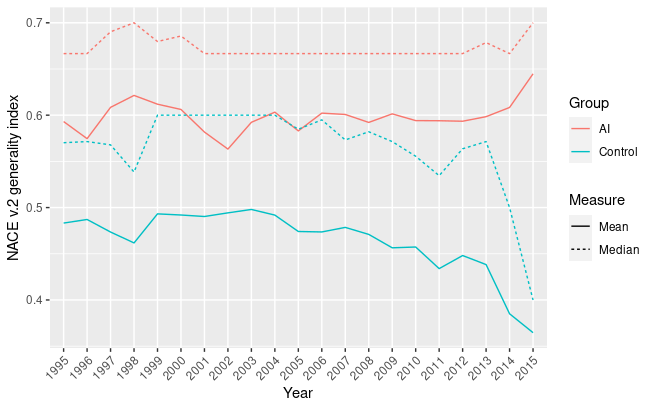
NACE v.2 generality index over time
Finally, in figure 1.5 is showed the generality index computed based on industrial categorization. Again, AI-related patents score higher than the control sample, with a hint of diverging behavior between 2013 and 2015, while in the end we assist to the usual truncation phenomenon, and thus a decrease in average generality.
Overall, we can affirm that AI-related patents have a high generality index, suggesting that, at least, AI technologies are applied in products that span in a variety of different technological and industrial areas. We also observe that, when generality is computed for patents filed in recent years, the average generality index decreases. As it was previously mentioned, this a known issue of forward-based patent measures and it is commonly referred to as the truncation problem. As the patent examined are closer to the present, the number of cumulative inventions decreases and thus we assist a reduction in forward citations. Since patents with only one forward citation were assigned \(G_i = 0\) by default, with the increase of the number of such patents, it is normal to assist a reduction in generality. To compensate for this phenomenon, in the graphs and tables of this analysis patents with only one forward citation were removed.42.
The results of the generality index computations are coherent for all metrics, suggesting that there is a correlation between the generality index in technological classification system and application industry. The CPC-based generality index has a median value comprised between 0.85 and 0.72 (figure 1.3), the Hall-Jaffe-Trajtenberg generality index has a median value comprised between 0.70 and 0.65 (figure 1.4, and the NACE v.2 generality index has a median value between 0.71 and 0.67 (figure 1.5).
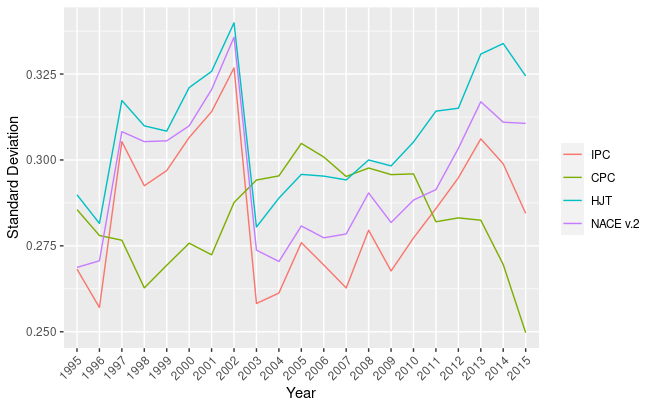
Standard deviation of generality index over time
The yearly variability of the patents generality index is particularly high for all indicators, ranging from 0.25 to 0.35, suggesting that there may be a polarization between generality indexes, with the values that are usually far from the mean (figure 1.6). Concluding, we can safely affirm that, based on these well-established indicators, AI technologies have an high degree of pervasiveness and technology complementarity.
4.3.3 Network-based indicators
Other scholars, such as Petralia (2020), suggested measuring technological pervasiveness using the adjacency matrix of technological classes. This method was also used by Cecere et al. (2014) and Tang et al. (2020) to map the evolution of a technology over time allowing the application of network analysis tools. In this section, I will apply similar techniques to find evidence of pervasiveness and technological complementarity, with the objective of posing the basis for a structural analysis of GPTs.
Following the intuition of Tang et al. (2020), I built a technology network of AI-related patents by treating technological classes and patents as the nodes in a bipartite graph. A patent can be assigned one or more technological classes. Suppose of having a sample of three patents: Patent 1 was assigned the technological classes CPC1, CPC2, and CPC3, patent 2 was assigned the technological classes CPC2 and CPC4, and patent 3 was assigned the technological classes CPC1 and CPC2. The relationships between patents and technological classes can be treated as an edge list for a bipartite graph, where patents are nodes of type 1 and technological classes are nodes of type 2 (figure 1.7). By projecting the nodes of type 2 (the technological classes) we obtain a weighted undirected technology network, where the weight of the edges represents the number of patents where those particular two technologies are co-occurring (figure 1.8 represents the projection of the technology network, while table 1.1 represents the adjacency matrix of the projection).
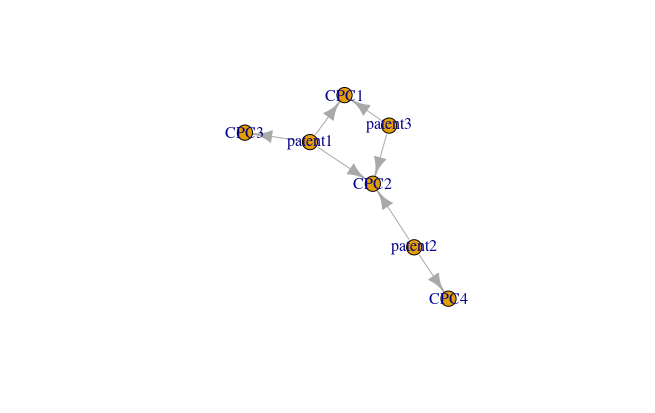
Bipartite graph representing the relations between patents and their respective technological classes
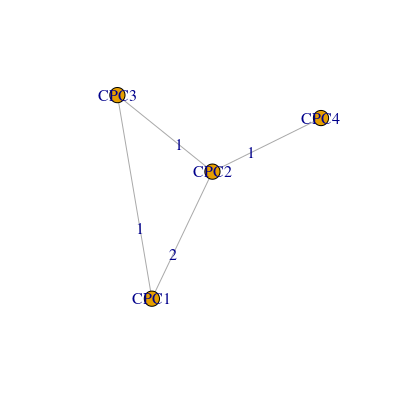
Technology projection representing the technological network formed by patents in figure 1.7
| CPC1 | CPC2 | CPC3 | CPC4 | |
| CPC1 | - | 2 | 1 | 0 |
| CPC2 | 2 | - | 1 | 1 |
| CPC3 | 1 | 1 | - | 0 |
| CPC4 | 0 | 1 | 1 | - |
\[tab:adj_matrix\]
As it is possible to observe in figure 1.7 and 1.8, since two patents are connected to CPC1 and CPC2, then the weight of the edge linking CPC1 and CPC2 is assigned a value of 2 in the projection, while all the other edges have a weight equals to 1.
After having mapped the sample of AI patents, I examined the evolution of the technology-based projection constructed using CPC technological classes using network science techniques.

Edge density
In figure 1.9 is shown the edge density of the technology network. The edge density represents the ratio of the number of edges and the number of possible edges (Wasserman, Faust, and others 1994). In the context of a technology network it represents the ratio between the existing links between technologies and their possible links. Obviously, not all links between technologies are possible, as it was mentioned in chapter three. However, GPTs should be able to create new non-existing links. In the AI technology network, after an initial decrease, it is possible to observe an upward trend, that shows AI technologies are decreasing the distance between different technological fields over time. Additionally, considering that the number of technological classifications increased along the years (and thus the number of possible links), the upward trend is particularly significant, since the number of links between different technological fields increased even when taking into consideration the increase in the number of possible connections.

Global transitivity
Similarly, figure 1.10 shows the evolution of the global transitivity of the AI technology network. The global transitivity represents the ratio of closed triangles over the possible triangles of the network. While we initially assist to a marked decrease in transitivity, probably caused by the increase in the possible connection between technologies, global transitivity rises again starting from 2010, indicating that, after an initial introduction of new technological classes, the ties between technological classes began reinforcing. In the context of studying GPTs, edge density and global transitivity are particularly useful in determining the degree of pervasiveness of a technology. An increasing trend in edge density indicates that the technology is becoming more and more pervasive in the economy.
Centralization measures are also particularly helpful to measure pervasiveness. To compare different networks, Freeman (1978) introduced the concept of centralization measures, that aims to determine the extent to which centrality measures distributions (the positions of networks nodes in respect to the center) informs us on the structure of the network as a whole. For the purpose of this analysis, we are particularly interested in the evolution of the degree centralization and betweenness centralization, that are based on degree and betweenness centrality, respectively.
The degree of a node is determined by the number of nodes it is connected to. In weighted networks, it is normally generalized as the sum of the weights of the links between nodes, also referred to as node strength:
\[C_{D}^{w}(i) = \sum_j^N{w_{ij}}\]
where \(w_{ij}\) is the weight between node \(i\) and node \(j\).
After having computed this measure for all the nodes, it can be generalized to compare graphs of different sizes, to obtain what Freeman (1978) has defined as degree centralization.
\[C_{D}^w(N) = \frac{\sum{\left(max(C_{D}^w) - C_{D}^{w}(i)\right)}}{(N_{nodes}-1)(N_{nodes}-2)max(w)}\]
where \(max(C_{D}^w)\) is the maximum weighted degree centrality of the network. Note that this measure is comprised between 0 and 1, where 0 indicates a low centralization and 1 indicates a high centralization.
Degree centralization indicates whether we assist a dominance of a particular group of nodes within the network in terms of weighted degree. Degree centralization informs us on whether there is a small number of nodes that are predominant and hold the majority of the connections with other nodes (in case of a high degree centralization) or instead the weighted degree is distributed evenly in the network (in case of a low degree centralization). In the context of the technology network, a high degree centralization suggest that a small number of technological classes are predominant in the network, thus being central for the technology took into consideration
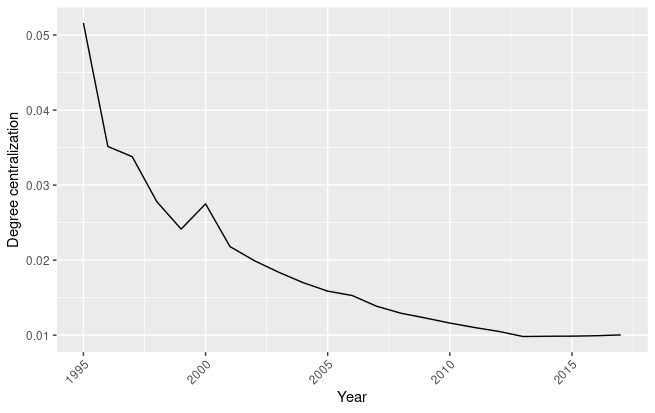
Evolution of degree centralization in the AI technology network
In figure 1.11 we observe that degree centralization is very low, with a maximum value of 0.05, and that with the passing of the years, it decreases up to become less than 0.01. This suggests that the technological classes found in AI-related patents are distributed evenly in the network, with a trend of equalizing the distribution of patents among the years. Degree centralization helps determining whether the distribution of edges and nodes weights is pervading the economy evenly or unevenly. In the case of AI technologies, we assist to a homogeneous process of technology expansion, suggesting that AI is distributing evenly in the various technological classes.
Another common indicator for studying networks is betweenness centrality. Betweenness is a centrality measure based on shortest paths and it is focused on determining the number of shortest paths between two nodes that pass through a specific node in the network.
\[C_{B}(i) = \frac{g_{jk}(i)}{g_{jk}}\]
where \(g_{jk}\) is the number of shortest paths between the nodes \(j\) and \(k\) and \(g_{jk}(i)\) is the number of those shortest paths that pass through \(i\). This centrality measures therefore aims to determine nodes in the network that are most likely to act as intermediaries between different nodes. In the framework of this analysis, the weight of the links is treated as a distance measure, thus, since a higher weight indicates that nodes are less distant to each other, to compute the betweenness centrality it is used its inverse (\(\frac{1}{w}\)). At the network level, betweenness centrality can be used to compute the betweenness centralization, that informs on the distribution of betweenness centrality among the nodes of the network. As suggested by Freeman (1978), betweenness centralization can be computed as:
\[C_{B}^w(N) = \frac{\sum{max(C_{B}^w) - C_{B}^{w}(i)}}{\frac{(N_{nodes}^{2}) - 3(N_{nodes}) + 2}{2}(N_{nodes} - 1)*max(w)}\]
note that this value is comprised between 0 and 1. Values of betweenness centralization closer to \(1\) indicate that the distribution of nodes is uneven, with a relatively low number of nodes that have a high betweenness centrality while the rest of the network has a low betweenness centrality. Values of betweenness centralization closer to \(0\) instead indicate that the betweenness centrality is distributed evenly among nodes.
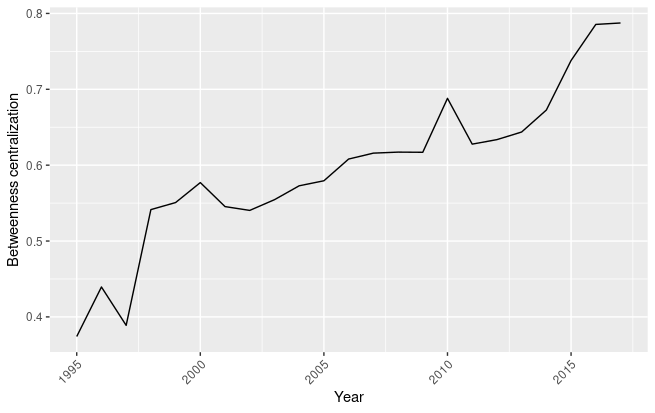
Evolution of betweenness centralization in the AI technology network
Figure 1.12 shows the evolution of the betweenness centralization of the AI technology network. We observe a progressive increase in betweenness centralization (that reaches a maximum of 0.78 in 2017), indicating that some technological classes are acting as bridges between nodes. From this can be derived that, along the years, some technological classes became essential in connecting nodes of different technological classes. For the purpose of determining whether a technology can be considered a GPT, betweenness centrality informs us on whether there is a group of essential technological classes that act as brokers in the diffusion in the economy. Technological with a high betweenness centrality are key elements for the diffusion of AI technologies, and they are likely to be the core technological classes needed for the implementation of AI in different application sectors.
Other than centralization, two measures are particularly interesting, since they explore technological complementarity: the number of new edges (so the number of new connections in the technology network) and the evolution of edge weights (how much existing edges are reinforced).
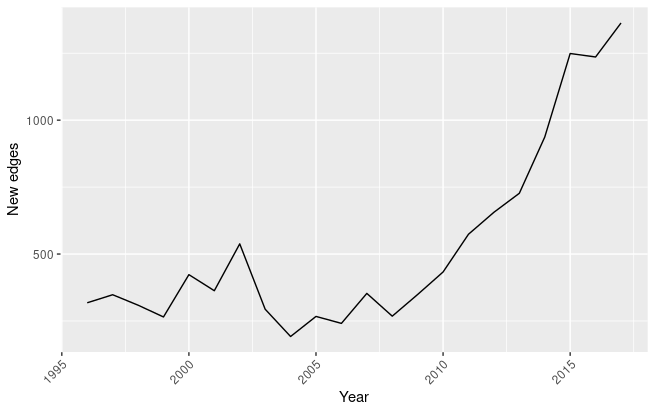
New edges in the network
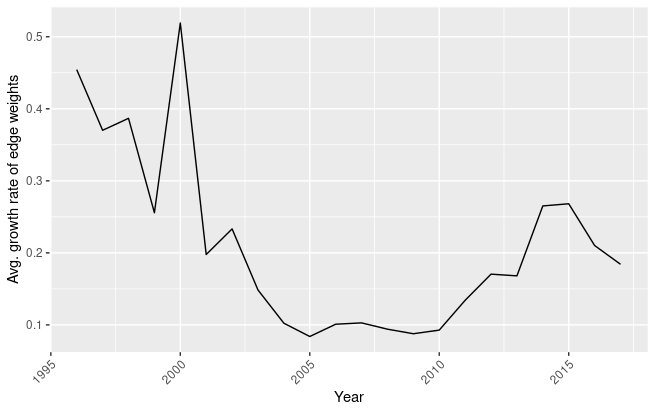
Average growth rate of the weights between existing edges
Recalling the theoretical framework proposed by Korzinov and Savin (2016), new edges can be modeled as new successful combinations of technologies. In figure 1.13 is represented the evolution of this indicator. We can observe that the number of entirely new edges increased consistently starting from 2006. As a consequence, it is possible to formulate the hypothesis that, starting from 2006, innovation complementarities derived from the introduction of AI technologies are increasing, often between different technological areas. If new edges are an important indicator to determine the inclusion of new technology recombinations in AI-related products, increases in edge weights are representative of the reinforcement of already existing links caused by the introduction of AI technologies. In figure 1.14 can be observed that, after a decrease in the average growth rate of edge weights, we are assisting to an increase in the reinforcement of already existing technology combinations.
4.3.4 Results
This analysis aimed to evaluate whether AI should be considered a General Purpose Technology. Recalling the definition of General Purpose Technology presented in chapter three, AI should be considered as such if it respects three requirements:
Technological dynamism;
Wide variety of application fields;
Strong complementarities with existing and new technologies.
We found proofs of the technological dynamism of AI-related technologies in the indicators presented in section 1.3.1, where the proportion of AI-related patents following the PCT route is increasing. In section 1.3.2, traditional indicators such as the percentage of IPC and CPC technological classes used in AI-related patents showed that AI technologies are indeed spreading across society, while the more subtle generality index was used to determine the extent to which AI technologies are sparkling innovation in a wide range of fields, confirming that, within the brief time-period took into examination, AI-related patents maintained a very high generality index, even when compared with a control sample.
Finally, in section 1.3.3 original network-based indicators to identify a GPT were presented. In particular they were focused on determining the extent to which AI-related patents recombined different technological fields to create new and innovative technological combinations. Network-based indicators are particularly useful because they provide information not only on the role of each patent in the sample, but also information on the structure of the sample itself. Specifically, edge density and transitivity showed that there is an upward trend in the number of technology combinations involving by AI technologies, suggesting that AI technologies are rapidly expanding and occupying a greater space in the economy, further confirmed by the increases in the number of new edges and the growth rate of the weights of existing edges. Degree and betweenness centralization instead informed on the inner dynamics of the technology network, showing that the strength of the connections between different technologies is distributed evenly among the different nodes while a few nodes occupy a central position. When we look at the top nodes in betweenness centrality, we observe that it is mostly occupied by technological classes related to computing, and specifically those typical of AI.
This analysis leads to the conclusion that AI is a technology that is developing at an astounding rate and occupying larger fractions of the economy, and that it is complementary to existing and new technologies, thus confirming the hypothesis that should be considered a GPT.
4.4 A note on technological concentration
In chapter three, I presented the claims made by Crémer, Montjoye, and Schweitzer (2019) on the progressive concentration of the digital market. I also suggested that this may be favored by a a competitive advantage in innovation caused by data repurposing and know-how. This brief section aims to verify whether a concentration of technological capabilities in the patent portfolios of a relatively small number of patent applicants is occurring.
Using the AI-related patents retrieved, I analyzed the concentration of patents using applicants’ names. Applicant names were subjected common preprocessing techniques to disambiguate patents formally filed under different names but that in the end belonged to the same entity.43 During the process of data cleansing, I took into consideration that up until 2011 in the United States only by natural persons (US Congress 2011), therefore many PCT patents filed at USPTO also indicated the inventors as applicants. In 2012 president Obama made the filing procedure possible also to legal entities. To minimize any methodological mistake, I eliminated applicants marked as individuals in patents including a legal entity. This has led me to obtaining a total of \(28317\) unique applicants.
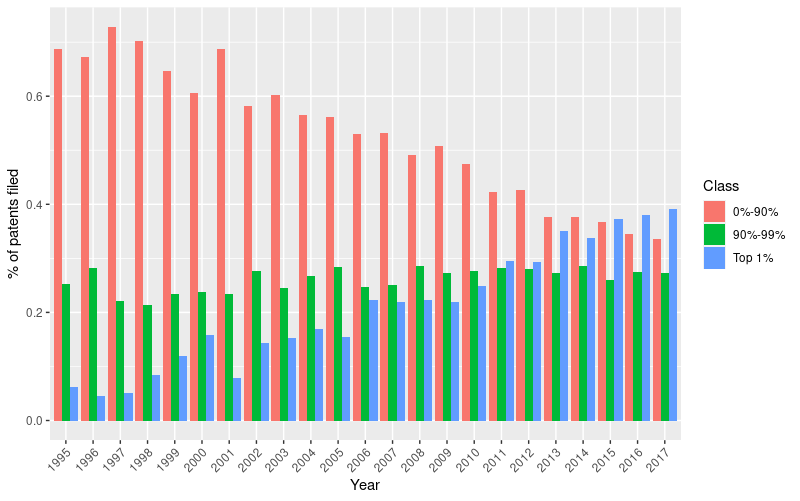
From an initial look at the average number of patents for each applicant it is possible to observe that the distribution is highly skewed in favor to applicants that have filed only one patent. Thus, in order to differentiate strong patentees from weak patentees, the sample was divided in three asymmetrical classes based on the number of filed patents per year: top 1%, 90%-99%, and lower 89%.44
Then, the yearly distribution of patents across these classes was plotted in figure 1.15. We can clearly observe that the number of AI-related patents filed by weak patentees is progressively declining in favor of the top %1 of patentees. This suggests that companies might have progressively increased their patenting rate in technologies involving AI.
 \[fig:rel_applt\]
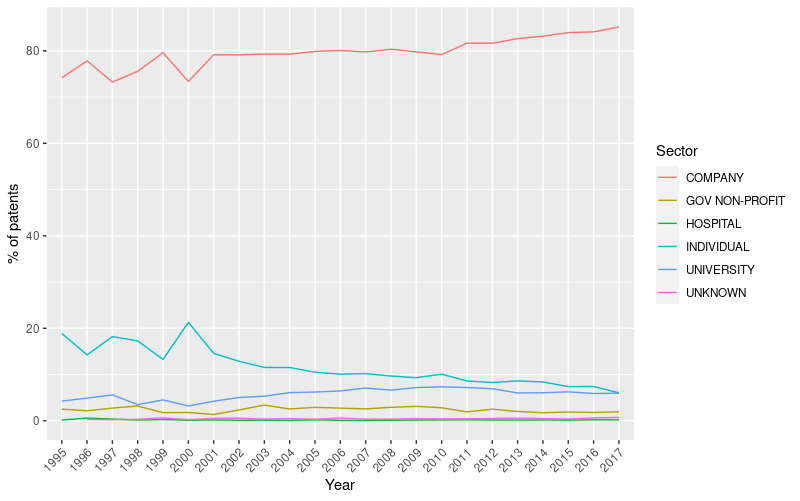
Data retrieved from PATSTAT also contains information related to the legal status of applicants, specifically on whether they are companies, public institutions, hospitals, universities, or individuals. In 1.16 it is plotted the percentage of yearly patents filed by these different categories.
 \[fig:applt_sector\]
It can be observed that the majority of AI-related are filed by companies, followed by individuals and universities. During the period taken in examination, the percentage of patents filed by companies rose from 74.2% to 85.1%, while those filed by individuals diminished from being the 18.9% to 6.0%, and those filed by universities increased from 4.3% to 6.0%. This empirical evidence confirms the assumptions of Crémer, Montjoye, and Schweitzer (2019), suggesting that today, the innovative push is mainly led by companies that are constantly increasing their innovative capabilities. From a merely innovation perspective this is not necessarily negative. In the past, big stable demanders were beneficial to the economy, since they provide a stable influx of investments in R&D that may avoid slowdowns in the rate of innovation caused by the negative horizontal externality of innovation complementarities mentioned in section three. At the same time, under the lenses of competition policy the scenario becomes more worrying. In fact, differently from the past45, this push is coming from private entities that can arbitrarily stop providing the fruits of their knowledge at any given moment. As a consequence, many argue in favor of a greater push towards public financing of AI technologies, especially within the European Union, that while being the location of many excellent research institutions producing high impact discoveries, lags behind in the private sector (Benzell et al. 2019), with no single firm capable to compete with American and Chinese digital giants, having no access to users’ data, a fundamental ingredient for increasing competitiveness in the AI field. Recalling the ways in which AI technologies spread in the market (competition for the market), in the absence of policies that favor the development of strong European-based private firms active in the AI field, the gap is only destined to increase.
4.5 Conclusions
The evidence presented in this chapter aimed to confirm the theoretical propositions presented in chapter three, regarding the fact that AI should be considered as a GPT. Both traditional indicators retrieved in the GPT literature (such as the generality index and the percentage of technological classes) and new network-based methods seems to point towards the conclusion that AI is indeed a GPT and that it is increasing its degree of pervasiveness in the economy at an impressive rate. Moreover, we are assisting towards a progressive concentration of AI-related patents in the portfolios of a proportionally small number of patent applicants. This confirms the theoretical basis provided by Crémer, Montjoye, and Schweitzer (2019), that calls for regulatory intervention by antitrust authorities.
However, since this study is based on patent data, it also has some of its limitations. First, as it was already mentioned, when dealing with forward-looking measures with recent data, we inevitably face issues related to truncation. While patents are invaluable sources of information regarding a developing a technology, when we use forward citations indicators to measure contemporary cutting-edge technologies, simply not enough time has passed to find evidence of their impact on the technological scenario. Second, patent documents were not designed to measure the process of technology diffusion, but rather as a legal tool to limit the claims of the citing patent. Therefore, even if it reasonable to consider patent citations as a proxy for technological diffusion, it may as well be the case that the inventor of a citing patent invented a product without knowledge of the cited invention. On the other hand, citations inform us on how a technology evolved and can help us to identify trajectories and focal inventions, especially when a patent is highly cited. Third, the use of the technology network as a proxy to measure innovation complementarities is still at an early stage. As a consequence, the results coming from this technique needs to be treated with extreme caution, especially when the technological sample regards such a particular technology as AI. Regardless, it is significant that the evolution of the technology network confirms the expectations provided by more traditional indicators, such as the generality index.
References
Abbate, Janet. 1999. Inventing the Internet. Cambridge: MIT Press.
Association for Computing Machinery, Inc. 2012. “ACM Computing Classification System [Data set].” New York, NY: Retrieved from https://dl.acm.org/ccs.
Benzell, Seth, Nick Bostrom, Erik Brynjolfsson, Yoon Chae, Frank Chen, Myriam Côté, Boi Faltings, Kay Firth-Butterfield, John Flaim, and Dario Floreano. 2019. “Technology Trends 2019: Artificial Intelligence.” WIPO.
Bianchini, Stefano, Moritz Müller, and Pierre Pelletier. 2020. “Deep Learning in Science.”
Brynjolfsson, Erik, Daniel Rock, and Chad Syverson. 2017. “Artificial Intelligence and the Modern Productivity Paradox: A Clash of Expectations and Statistics.” National Bureau of Economic Research.
Cecere, Grazia, Nicoletta Corrocher, Cedric Gossart, and Muge Ozman. 2014. “Technological Pervasiveness and Variety of Innovators in Green Ict: A Patent-Based Analysis.” Research Policy 43 (10): 1827–39.
Cockburn, Iain, Rebecca Henderson, and Scott Stern. 2018. “The Impact of Artificial Intelligence on Innovation.” National bureau of economic research.
Crémer, Jacques, Yves-Alexandre de Montjoye, and Heike Schweitzer. 2019. “Competition Policy for the Digital Era.” European Commission.
Feldman, Maryann, and Ji Woong Yoon. 2012. “An Empirical Test for General Purpose Technology: An Examination of the Cohen–Boyer rDNA Technology.” Industrial and Corporate Change 21 (2): 249–75.
Freeman, Linton. 1978. “Centrality in Social Networks Conceptual Clarification.” Social Networks 1 (3): 215–39.
Hall, Bronwyn. 2005. “A Note on the Bias in Herfindahl-Type Measures Based on Count Data.” Revue d’économie Industrielle 110 (1): 149–56.
Hall, Bronwyn, and Manuel Trajtenberg. 2004. “Uncovering Gpts with Patent Data.” National Bureau of Economic Research.
Henderson, Rebecca, Adam Jaffe, and Manuel Trajtenberg. 1995. “Universities as a Source of Commercial Technology: A Detailed Analysis of University Patenting, 1965–1988.” Working Paper 5068. National Bureau of Economic Research.
Jaffe, Adam, Manuel Trajtenberg, and Rebecca Henderson. 1993. “Geographic Localization of Knowledge Spillovers as Evidenced by Patent Citations.” The Quarterly Journal of Economics 108 (3): 577–98.
Jovanovic, Boyan, and Peter Rousseau. 2005. “General Purpose Technologies.” In Handbook of Economic Growth, 1:1181–1224. Elsevier.
Klinger, Joel, Juan Mateos-Garcia, and Konstantinos Stathoulopoulos. 2018. “Deep Learning, Deep Change? Mapping the Development of the Artificial Intelligence General Purpose Technology.” \url{https://arxiv.org/abs/1808.06355}.
Korzinov, Vladimir, and Ivan Savin. 2016. “Pervasive Enough? General Purpose Technologies as an Emergent Property.” Working Paper Series in Economics. Karlsruhe Institute of Technology (KIT), Department of Economics; Management.
Moser, Petra, and Tom Nicholas. 2004. “Was Electricity a General Purpose Technology? Evidence from Historical Patent Citations.” American Economic Review 94 (2): 388–94.
Nardin, Alessio. 2021. “AI-as-Gpt.” GitHub Repository. https://github.com/AlessioNar/AI-as-GPT; GitHub.
Petralia, Sergio. 2020. “Mapping General Purpose Technologies with Patent Data.” Research Policy 49: 104013.
Silverman, Brian. 2002. “Documentation for International Patent Classification–Us Sic Concordance.” University of Toronto.
Tang, Ying, Xuming Lou, Zifeng Chen, and Chengjin Zhang. 2020. “A Study on Dynamic Patterns of Technology Convergence with Ipc Co-Occurrence-Based Analysis: The Case of 3D Printing.” Sustainability 12: 2655.
Toole, Andrew, Nicholas Pairolero, Alexander Giczy, James Forman, Christyann Pulliam, Mattew Such, Kakali Chaki, et al. 2020. “Inventing Ai: Tracing the Diffusion of Artificial Intelligence with Us Patents.” October.
US Congress. 2011. “Leahy-Smith America Invents Act - Public Law 112–29.”
The standard formula for generality is computed as \(G_{i} = 1-\sum{\frac{\left(s_{ij}\right)^2}{NClass_J}}\) and it is presented in detail in section 1.3.2.↩︎
The citations of a citation↩︎
The US patent classes, Hall-Jaffe-Trajtenberg technology subcategories, and the International Patent Classification↩︎
Industry of manufacture and Industry of use, based on Silverman (2002)↩︎
World Intellectual Property Organization and United States Patents and Trademark Office.↩︎
A summary of WIPO query strategy can be found in appendix B↩︎
The complete code used during the analysis can be found on the MyThesis repository on Github https://github.com/AlessioNar/MyThesis (Nardin 2021).↩︎
In appendix E it is possible to find the values used to draw these graphs, respectively in tables 4.1 and 4.2↩︎
In figures 1.3, 1.4, 1.5 and 1.6 the x axis is truncated in 2015. As it was previously mentioned, this choice is motivated by the fact that recent patents have a low number of forward citations, thus invalidating the results of the generality computation for the years 2016 and 2017.↩︎
Details on the construction of the control sample are provided in appendix B↩︎
Along the lines of previous work by Hall and Trajtenberg (2004)↩︎
In table 4.8 it is possible to absolute number of applicants assigned to each class by year.↩︎
Such as the invention and development of the internet, a project that involved the collaboration between the military and public research entities. See Abbate (1999) for reference.↩︎